Power BI is a business analytics service developed by Microsoft. It provides interactive visualizations and business intelligence capabilities with an interface simple enough for end users to create their own reports and dashboards. Here are some key features and components of Power BI:
1. Power BI Desktop: A Windows application for creating reports and data visualizations.
2. Power BI Service: An online SaaS (Software as a Service) service for sharing and collaborating on Power BI reports and dashboards.
3. Power BI Mobile Apps: Applications for iOS, Android, and Windows mobile devices, allowing users to view and interact with Power BI reports and dashboards on the go.
4.Power BI Gateway: Bridges cloud services and on-premises data sources, enabling secure data transfer.
5. Power BI Embedded: Allows developers to embed Power BI dashboards and reports into their own applications.
6. Power Query: A data connection technology that enables users to discover, connect, combine, and refine data across a wide variety of sources.
7. Power Pivot: A data modeling tool that allows users to create data models, establish relationships, and perform calculations.
8.Power View: An interactive data visualization tool that enables users to create, share, and explore data.
Power BI helps organizations make data-driven decisions by transforming raw data into actionable insights through interactive dashboards and reports.
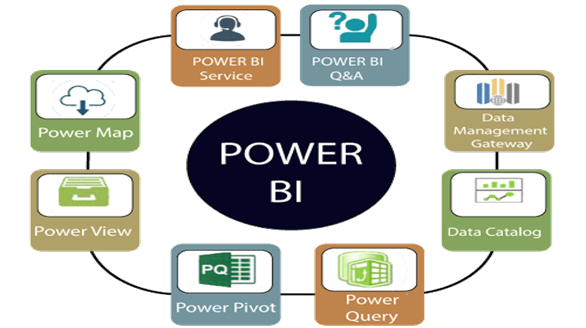
What are the major components of Power BI?
Power BI comprises several major components, each playing a vital role in data analytics and visualization:
1. Power BI Desktop:
– A Windows application used for data exploration, transformation, and visualization.
– Allows users to create detailed reports and complex data models.
– Supports a variety of data sources for integration and analysis.
2. Power BI Service:
– An online SaaS (Software as a Service) platform for sharing, collaborating, and managing Power BI reports and dashboards.
– Enables users to publish reports created in Power BI Desktop to the cloud.
– Offers features like workspaces, apps, and shared dashboards for collaboration.
3. Power BI Mobile Apps:
– Applications for iOS, Android, and Windows mobile devices.
– Allow users to access, view, and interact with Power BI reports and dashboards on the go.
4. Power BI Gateway:
– A bridge that connects on-premises data sources with the Power BI Service.
– Ensures secure data transfer and real-time data refresh from on-premises sources.
5. Power BI Report Server:
– An on-premises server for hosting Power BI reports.
– Ideal for organizations that require a private cloud environment or have specific regulatory requirements.
– Allows users to publish, share, and manage Power BI reports within their own infrastructure.
6. Power BI Embedded:
– A service that enables developers to embed Power BI reports and dashboards into custom applications.
– Provides APIs and controls for integration into web and mobile apps, offering a seamless analytics experience.
7. Power Query:
– A data connection technology for discovering, connecting, combining, and refining data across various sources.
– Integrated into Power BI Desktop, Excel, and other Microsoft products.
8. Power Pivot:
– A data modeling tool that allows users to create sophisticated data models, define relationships, and perform advanced calculations.
– Used in Power BI Desktop and Excel to enhance data analysis capabilities.
9. Power View:
– An interactive data visualization tool within Power BI and Excel.
– Enables users to create dynamic charts, graphs, and maps for data exploration.
10. Power Q&A:
– A natural language processing feature that allows users to ask questions about their data and get answers in the form of visualizations.
– Enhances data accessibility and user interactivity.
These components collectively provide a comprehensive suite for data analytics, enabling users to transform raw data into actionable insights through various visualization and reporting tools.