
Power BI, “Get Data” refers to the feature that allows users to connect to various data sources, import data, or perform queries to retrieve and load data into Power BI for analysis and visualization. It is a critical step in the data acquisition process within Power BI Desktop. Here’s an overview of what “Get Data” entails:
Key Aspects of “Get Data”:
1. *Data Sources*:
– *Connect to a Variety of Sources*: Users can connect to a wide range of data sources, including databases (SQL Server, Oracle, MySQL), files (Excel, CSV, XML, JSON), online services (Azure, Salesforce, Google Analytics), and more.
– *Pre-Built Connectors*: Power BI provides pre-built connectors for popular data sources, simplifying the connection process.
2. *Data Import and Querying*:
– *Import Data*: Users can import data directly into Power BI for local processing and analysis.
– *Query Data*: Allows users to perform queries against the data source to retrieve specific data subsets or apply transformations before importing.
3. *Get Data Dialog*:
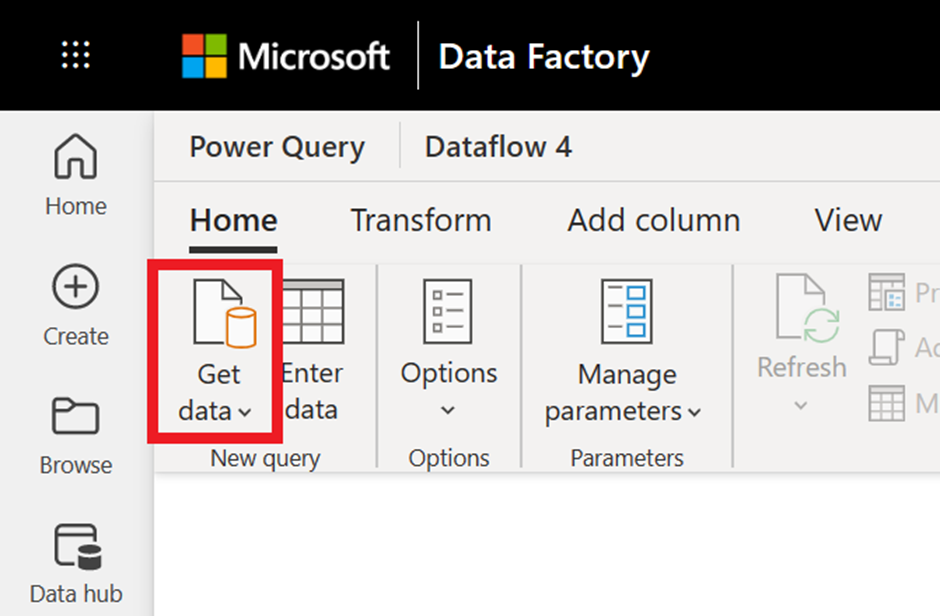
– *Interface*: Accessed through the “Get Data” button on the Power BI Desktop ribbon.
– *Navigation*: Organized by categories such as File, Database, Online Services, Azure, and more.
– *Search and Browse*: Users can search for specific connectors or browse through available options.
4. *Connectivity Options*:
– *Direct Query*: Allows users to connect to data sources live, enabling real-time data analysis without importing data into Power BI.
– *Import Mode*: Data is imported into Power BI and stored locally or in the Power BI Service, offering fast performance for data analysis.
– *Composite Models*: Allows combining imported data with Direct Query connections within the same Power BI model.
5. *Data Refresh*:
– *Scheduled Refresh*: In Power BI Service, users can schedule automatic refreshes of imported data to keep reports and dashboards up-to-date with the latest information.
– *On-Demand Refresh*: Users can manually refresh data in Power BI Desktop or Service when needed.
6. *Advanced Data Transformations*:
– *Power Query Integration*: Data retrieved using “Get Data” can be further refined and transformed using Power Query Editor in Power BI Desktop.
– *Data Preparation*: Users can clean, transform, and shape data to suit their analysis and reporting needs before loading it into Power BI.
Workflow
Workflow of Using “Get Data” in Power BI:
1. *Accessing Get Data*:
– Open Power BI Desktop.
– Click on the “Get Data” button in the Home tab of the ribbon.
2. *Selecting Data Source*:
– Choose the desired data source from the list of available connectors.
– Alternatively, use the search box to find a specific connector.
3. *Connecting and Importing*:
– Enter connection details (e.g., server name, database name, credentials) if required.
– Optionally, write SQL queries or apply filters to retrieve specific data subsets.
– Load the data into Power BI by importing or connecting via Direct Query .
4. *Data Preparation*:
– Use the Power Query Editor to clean, transform, and reshape data as needed.
– Perform data modeling tasks such as defining relationships, creating calculated columns, and adding measures.
5. *Loading Data*:
– Load the refined data into Power BI Desktop for further analysis and visualization.
– Publish reports and dashboards to Power BI Service for sharing and collaboration.
“Get Data” in Power BI is fundamental for accessing, importing, and transforming data from various sources, enabling users to create insightful reports and dashboards based on their business data. It supports both simple data import tasks and complex data integration scenarios across on-premises and cloud-based data sources.
What are filters in Power BI
what are filters in Power BI?
In Power BI, filters are used to restrict data displayed in visuals (charts, tables, graphs, etc.) based on specified criteria. They are essential for focusing on specific subsets of data to analyze trends, patterns, and outliers effectively. Here’s an overview of the types and functionalities of filters in Power BI:
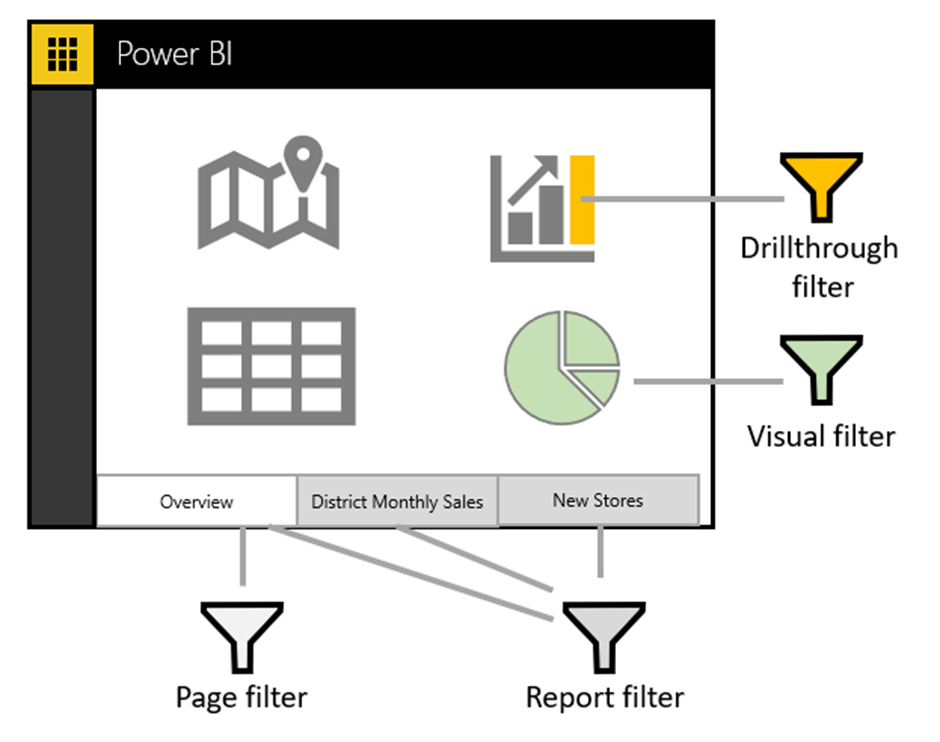
### Types of Filters in Power BI:
1. *Report-Level Filters*:
– Apply to all visuals on a specific report page.
– Control which data is visible across the entire report page.
– Set at the report level and affect all visuals on that page unless overridden at the visual level.
2. *Page-Level Filters*:
– Apply to all visuals on a specific report page.
– Similar to report-level filters but scoped to a single page within the report.
3. *Visual-Level Filters*:
– Apply to individual visuals (charts, tables, etc.) within a report.
– Customize the data displayed in each visual independently.
– Visual-level filters can override page-level and report-level filters for that specific visual.
4. *Drill through Filters*:
– Allow users to drill through from one report page to another, passing filter context along.
– Defined in the source page and applied when a user drills through to the target page.
5. *Cross-Visual Filters*:
– Enable interactions between visuals on the same report page.
– When a filter is applied to one visual, it dynamically updates the data displayed in other visuals based on the selected criteria.
6. *Top N Filters*:
– Limit visuals to display only the top or bottom N items based on a specified measure (e.g., top 10 sales, bottom 5 products by revenue).
– Useful for focusing on the most significant contributors or outliers in data.
7. *Slicers*:
– Visual filters represented as interactive controls (e.g., dropdowns, list boxes) on a report page.
– Allow users to select specific values from a field or hierarchy to filter data across multiple visuals simultaneously.
Functionalities of Filters:
– *Basic Filtering*: Selecting specific values or ranges to include or exclude from visuals.
– *Advanced Filtering*: Using complex conditions, formulas, or DAX expressions to filter data dynamically.
– *Relative Date Filtering*: Filtering data based on relative time periods (e.g., last 30 days, current month, year-to-date).
– *Hierarchical Filtering*: Applying filters to hierarchical data structures (e.g., filtering by region, country, city).
How Filters Work:
– *Filter Context*: Determines which rows of data are visible to calculations and visuals based on applied filters.
– *Visual Interaction*: Filters applied to one visual can affect the data displayed in other visuals on the same report page through cross-visual filtering.
– *Performance Considerations*: Filters should be used strategically to optimize report performance, especially when dealing with large datasets or complex queries.
Benefits of Using Filters in Power BI:
– *Focus*: Allow users to focus on specific subsets of data relevant to their analysis.
– *Interactivity*: Enhance interactivity by enabling users to explore data dynamically.
– *Consistency*: Ensure consistency across reports by applying standardized filters.
– *Performance*: Improve report performance by reducing the amount of data processed and displayed.
Filters in Power BI are versatile tools that empower users to customize their data views, perform detailed analyses, and gain actionable insights from their business data. They play a crucial role in creating interactive and informative reports and dashboards.
Other Courses