
In Power BI, a dashboard is a single-page, often called a canvas, that uses visualizations to tell a story. Because it is limited to one page, a well-designed dashboard contains only the most important elements of that story.
Key Features of a Power BI Dashboard
- Single Page Layout:
- Dashboards are confined to a single page, making them a concise summary of insights derived from your data.
- Tiles:
- A dashboard is made up of tiles, which are individual visualizations pinned from reports. Each tile can display data visualizations such as charts, graphs, maps, and tables.
- Interactive:
- Users can interact with the dashboard tiles, such as clicking on them to drill down into more detailed reports.
- Real-time Data:
- Dashboards can display real-time data if they are connected to live data sources. This is particularly useful for monitoring key performance indicators (KPIs).
- Pinning Visuals:
- Visuals are pinned to dashboards from reports, datasets, or other sources within Power BI.
- Cross-Source Integration:
- A dashboard can pull in visuals from multiple reports and datasets, providing a comprehensive view of data from various sources.
- Customizable:
- Users can customize the layout and appearance of a dashboard to meet specific needs, adjusting the size, position, and content of the tiles.
- Sharing and Collaboration:
- Dashboards can be shared with other users within the Power BI Service, fostering collaboration and data-driven decision-making within organizations.
Differences Between Dashboards and Reports
- Reports:
- Typically have multiple pages.
- Contain a variety of visualizations, filters, and insights.
- Allow for more in-depth analysis and interaction.
- Dashboards:
- Restricted to a single page.
- Offer a high-level view of the most critical data points.
- Primarily used for monitoring and quick insights.
Use Cases for Dashboards
- Executive Summaries: Providing a high-level overview of business performance for executives.
- Monitoring KPIs: Tracking key performance indicators in real time.
- Quick Insights: Offering a snapshot of data for quick decision-making.
Example
Consider a sales dashboard that might include:
- A line chart showing sales trends over the past year.
- A bar chart comparing sales performance across different regions.
- A KPI tile displaying the current month’s sales against the target.
- A map visual showing geographic distribution of sales.
Each of these visualizations can be pinned from different reports or datasets, creating a comprehensive, at-a-glance view of sales performance.
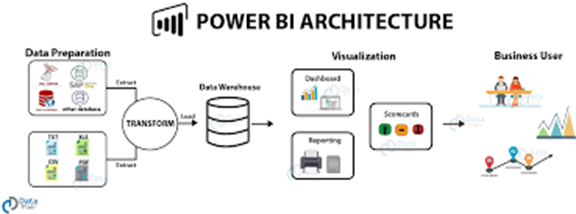
What are the building blocks of power BI?
Power BI consists of several key building blocks that together provide a comprehensive platform for data analysis, visualization, and business intelligence. Here are the primary building blocks of Power BI:
1. Visualizations
– *Definition*: Visual representations of data, such as charts, graphs, maps, tables, and gauges.
– *Purpose*: To make data easily understandable and actionable by highlighting trends, patterns, and outliers.
2. Datasets
– Definition Collections of data that are imported, connected, or queried in Power BI.
– *Purpose*: Serve as the source of data for visualizations and reports. Can come from various sources, including databases, Excel files, cloud services, and more.
3. Reports
– *Definition*: Multi-page documents that contain a variety of visualizations based on a single dataset.
– *Purpose*: Provide detailed data analysis, exploration, and storytelling through interactive visuals. Reports allow users to drill down into data and explore it from different perspectives.
4. Dashboards
– *Definition*: Single-page, often referred to as a canvas, that combines visualizations from one or more reports.
– *Purpose*: Offer a high-level overview of important metrics and key performance indicators (KPIs). Dashboards are used for monitoring and quick insights.
5. Tiles
– *Definition*: Individual visual elements on a dashboard, such as a chart, graph, or KPI.
– *Purpose*: Provide snapshots of specific metrics or insights, which users can click on to navigate to more detailed reports.
6. Dataflows
– *Definition*: ETL (Extract, Transform, Load) processes within Power BI that allow users to define, cleanse, and transform data from multiple sources.
– *Purpose*: Enable reusable data preparation and centralized data management. Dataflows store data in Azure Data Lake Storage.
7. Datasets
– *Definition*: Collections of data that have been processed and are ready for analysis and visualization.
– *Purpose*: Serve as the foundation for reports and dashboards, enabling users to build visualizations based on the curated data.
8.Models
– *Definition*: Logical structures that define relationships, calculations, measures, and hierarchies within datasets.
– *Purpose*: Provide the framework for data analysis and ensure that users can perform meaningful queries and calculations on their data.
9. Reports and Dashboards (Publish)
– *Definition*: Sharing and collaboration features that allow users to publish reports and dashboards to the Power BI service.
– *Purpose*: Facilitate collaboration, distribution, and access control within an organization, enabling users to share insights and data with others.
10. Power BI Service (Cloud)
– *Definition*: The online SaaS (Software as a Service) component of Power BI.
– *Purpose*: Hosts published reports and dashboards, provides data storage, and supports collaboration, sharing, and access control.
11.Power BI Mobile Apps
– *Definition*: Applications for accessing Power BI reports and dashboards on mobile devices (iOS, Android, and Windows).
– *Purpose*: Ensure that users can stay informed and interact with their data on the go, providing real-time insights and updates.
12. Power BI Embedded
– *Definition*: A service that allows developers to embed Power BI reports and dashboards into their own applications.
– *Purpose*: Provide custom analytics solutions and seamless integration of Power BI capabilities into third-party apps and websites.
These building blocks collectively create a robust ecosystem within Power BI, allowing users to connect to various data sources, transform and model data, create interactive visualizations, and share insights across their organization
Other Courses: